Revolutionize your flowback with Revo iQ®
Oilfield Operations—where the unexpected can and will occur. Your ability to effectively communicate, think critically, and react is what separates the top operators from your ‘middle-of-the-road O&G LLC’. Data quality and surveillance are recognized as fundamental keys to informed oilfield operations. Technologies have emerged in drilling and completions that provide real-time data visualizations, key performance indicators, and analysis. However, the flowback & well testing sector has been slow to implement technology that improves operational surveillance. Conventional flowback reporting methods—typically using handwritten field data sheets, then transposed to email reports—are subject to multiple physical measurement errors and technical hurdles. Issues such as; data being ‘lost’ in a tally-book, a field laptop malfunction, or simple operator oversight in emailing reports, will impede timely well performance diagnostics and choke management decision making.
The problems seen in conventional flowback reporting methods can have lasting detrimental impacts on the productivity of a developing field. Surface data quality during early time flowback is critical to evaluating initial reservoir response and accurately assessing well performance. Physical measurement errors, or delays in reporting, can distort well performance interpretation, trigger ill-advised drawdown procedures, damage the completion quality, and ultimately de-value the asset.
Revo Testing Technologies (“Revo”) understands that data quality and surveillance are fundamental to optimizing your early stage flowback operations. As part of the Flowsmart® solution set, we are proud to introduce the Revo iQ® software suite. Revo iQ® is the engineered solution to problems that customers face when using traditional methods of flowback surveillance and well performance visualization.

Revo iQ™ Mobile Surveillance and Data Visualization
There are three distinct ways Revo iQ® software improves surveillance during flowback operations. Users can 1) view data plots on-demand from a mobile device or PC, 2) receive notifications when measurement errors are identified or production milestones are reached, and 3) set automated email reports to receive data at any frequency.
First, Revo iQ® streamlines the flowback data transfer process to improve operational surveillance. The process is simple and can be integrated with Revo or a third party well testing measurement systems. Prior to flowback operations, simply download the Revo iQ® app using either button below, and log into the secure customer access portal. During flowback, data can be manually entered into the Revo iQ® app. Data can also be streamed directly to Revo iQ® from either Revo’s automated well testing system or your own equipment. Raw data and production data trends are displayed in real-time on any mobile device, or from your web browser.

blank
Second, Revo’s software allows users to receive notifications when potential measurement errors are identified, and when production milestones are reached. With the Revo iQ® visualization software, users are able to quickly QA/QC surface measurements and identify problems. Gone are the days where a string of phone calls is required to change the flowback report when data entry errors or measurement issues occur. With Revo iQ®, you will be notified of the data errors and will have the ability to view or correct the mis-calculation from your phone or web interface.
And last, Revo iQ® software provides automated email reports at any required frequency. No more delayed reports–flowback data is automatically compiled and sent to streamline the reporting process. Revo iQ® software equips users with data quality assurance, and real-time data visualization, for full oversight of well testing operations from any mobile device or web browser.
Revo iQ® Real-Time Well Performance Diagnostics and Comparison Plotting
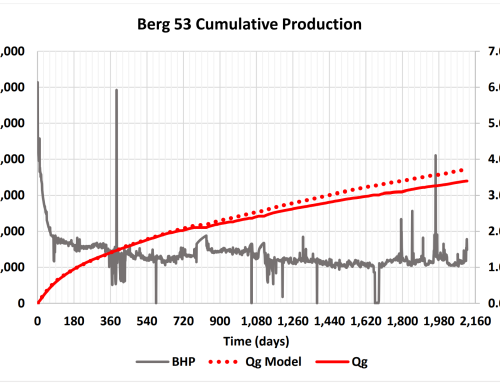
Revo iQ® software also provides instant access to real-time well performance diagnostics, real-time BHP calculations, and well comparison plotting. Well performance indicators and real-time BHP calculations are displayed on the Revo iQ® dashboard. From any mobile device or PC, the performance indicators seen below empower users to quickly assess oil, gas, and water rates, and optimize production. The green (optimal performance), yellow (reexamine procedure), and red (needs immediate attention) performance management indicators keep you informed of your wells’ performance to guide your overall drawdown strategy. This enhanced operational surveillance and data-quality assurance permits Revo iQ® software to calculate BHP in real-time, with a high degree of confidence. The performance management indicators and real-time BHP calculations help users manage drawdown strategy from any device, anywhere and anytime.
In addition, well comparison plotting allows offset well performance to drive flowback strategies, assess EOR recovery methods, and identify parent-child effects. Flowback data from multiple wells can be compared using the dynamic well plotting function, which allows users to clearly compare many different production parameters over time. The well comparison utility allows for early identification of relative differences in well performance, mitigating the complications of parent and child interactions, and ultimately improving NPV of the asset. Contact Revo Testing Technologies for a free trial and release the power of real-time data visualization to support clear and informed decisions during your flowback operations at info@revotest.com or using the form below. For more information please visit the Revo iQ page here.


Leave A Comment